Recent Posts
Categories
Search
Join 22 other subscribers
USING NUMBERS TO LOOK AT THE NHL'S FUTURE STARS
Follow @toddcordell
As someone who scouts junior hockey, I like to gather as much information about prospects as possible to help form opinions, rankings, etc.
One thing I started doing a few years ago is splitting draft eligible’s seasons into two halves and comparing the production between the two.
Points aren’t everything, but they are important, and generally a player’s production can help illustrate how well said player is performing. Not to mention if a player isn’t producing much at the junior level it’s probably not realistic to expect them to do so in the NHL.
Another reason I started doing this, is that the NHL entry draft is sort of like a stock market. Prior years of performance factor in, but who is trending up or down the most often determines where a prospect goes come June.
For example, would you rather have a player who posted 40 points in 34 games during the 1st half and 25 in 34 games during the 2nd half, or someone who tallied 25 points in the first 34 games, and 40 in the latter half? Most will pick the guy who produced more in the 2nd half because – on top of recency bias – people want to add players whose progression is noticeable.
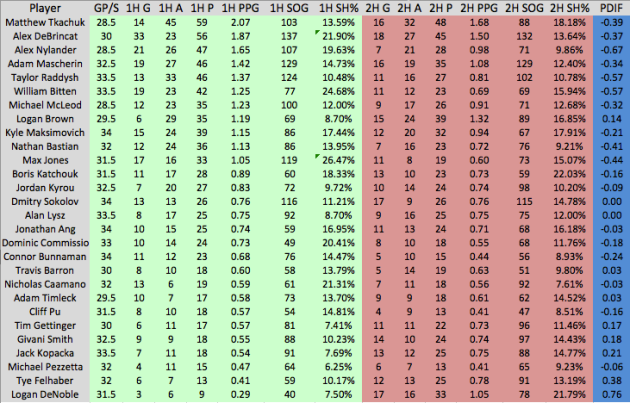
For added context, this year I also included shots and shooting percentage.
This helps illustrate if a player’s decrease in goal scoring, for example, is a result of bad luck or a lack of shots/looks. It also helps tell us if a player’s spike in production is due to riding unsustainably high percentages.
OHL Forwards (sorted by 1st half PPG)
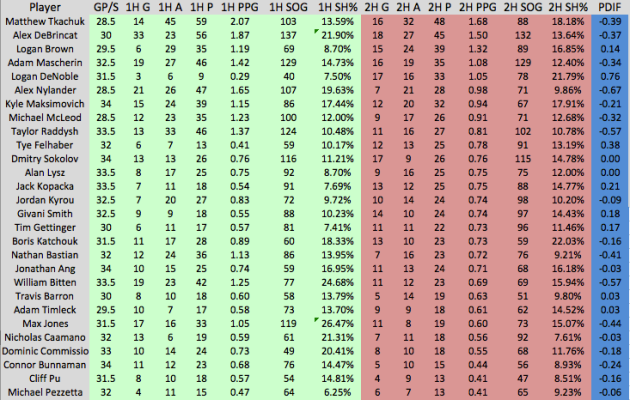
OHL Forwards (sorted by 2nd half PPG)
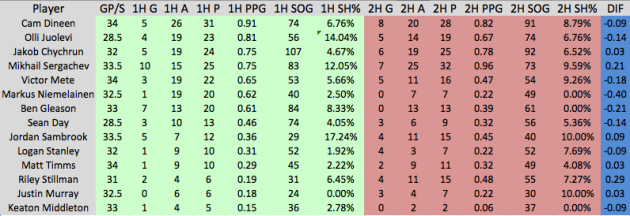
OHL Defensemen (sorted by 1st half PPG)
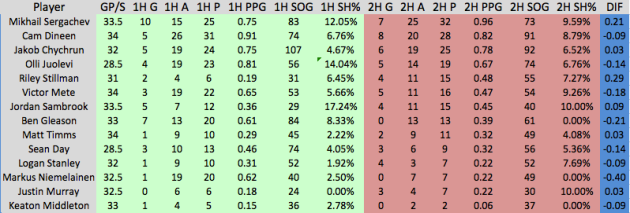
OHL Defensemen (sorted by 2nd half PPG)
**
If you use or share this data, please cite this blog as the resource. Thanks!
